- Platform
- Reporting
Reporting software for your marketing campaigns
Drive more value out of your campaigns with our holistic reporting options. See what works, identify any gaps, and effortlessly quantify your ROI.

Get meaningful insights about your audiences
Bring data from across your campaigns into one place to see what resonates best with your contacts. With our comprehensive reporting features, you can create and customize dashboards to compare your most important metrics side-by-side.
Make the most of your segments, spot trends before anyone else, and find the most effective ways to visualize your marketing and sales performance.
Reporting options for any business
No matter what you do, our platform helps you find a way to cut through the noise and get to the data that matters most.
Automation
See which automations are the most effective. Compare triggers, conditions, scheduling, and more.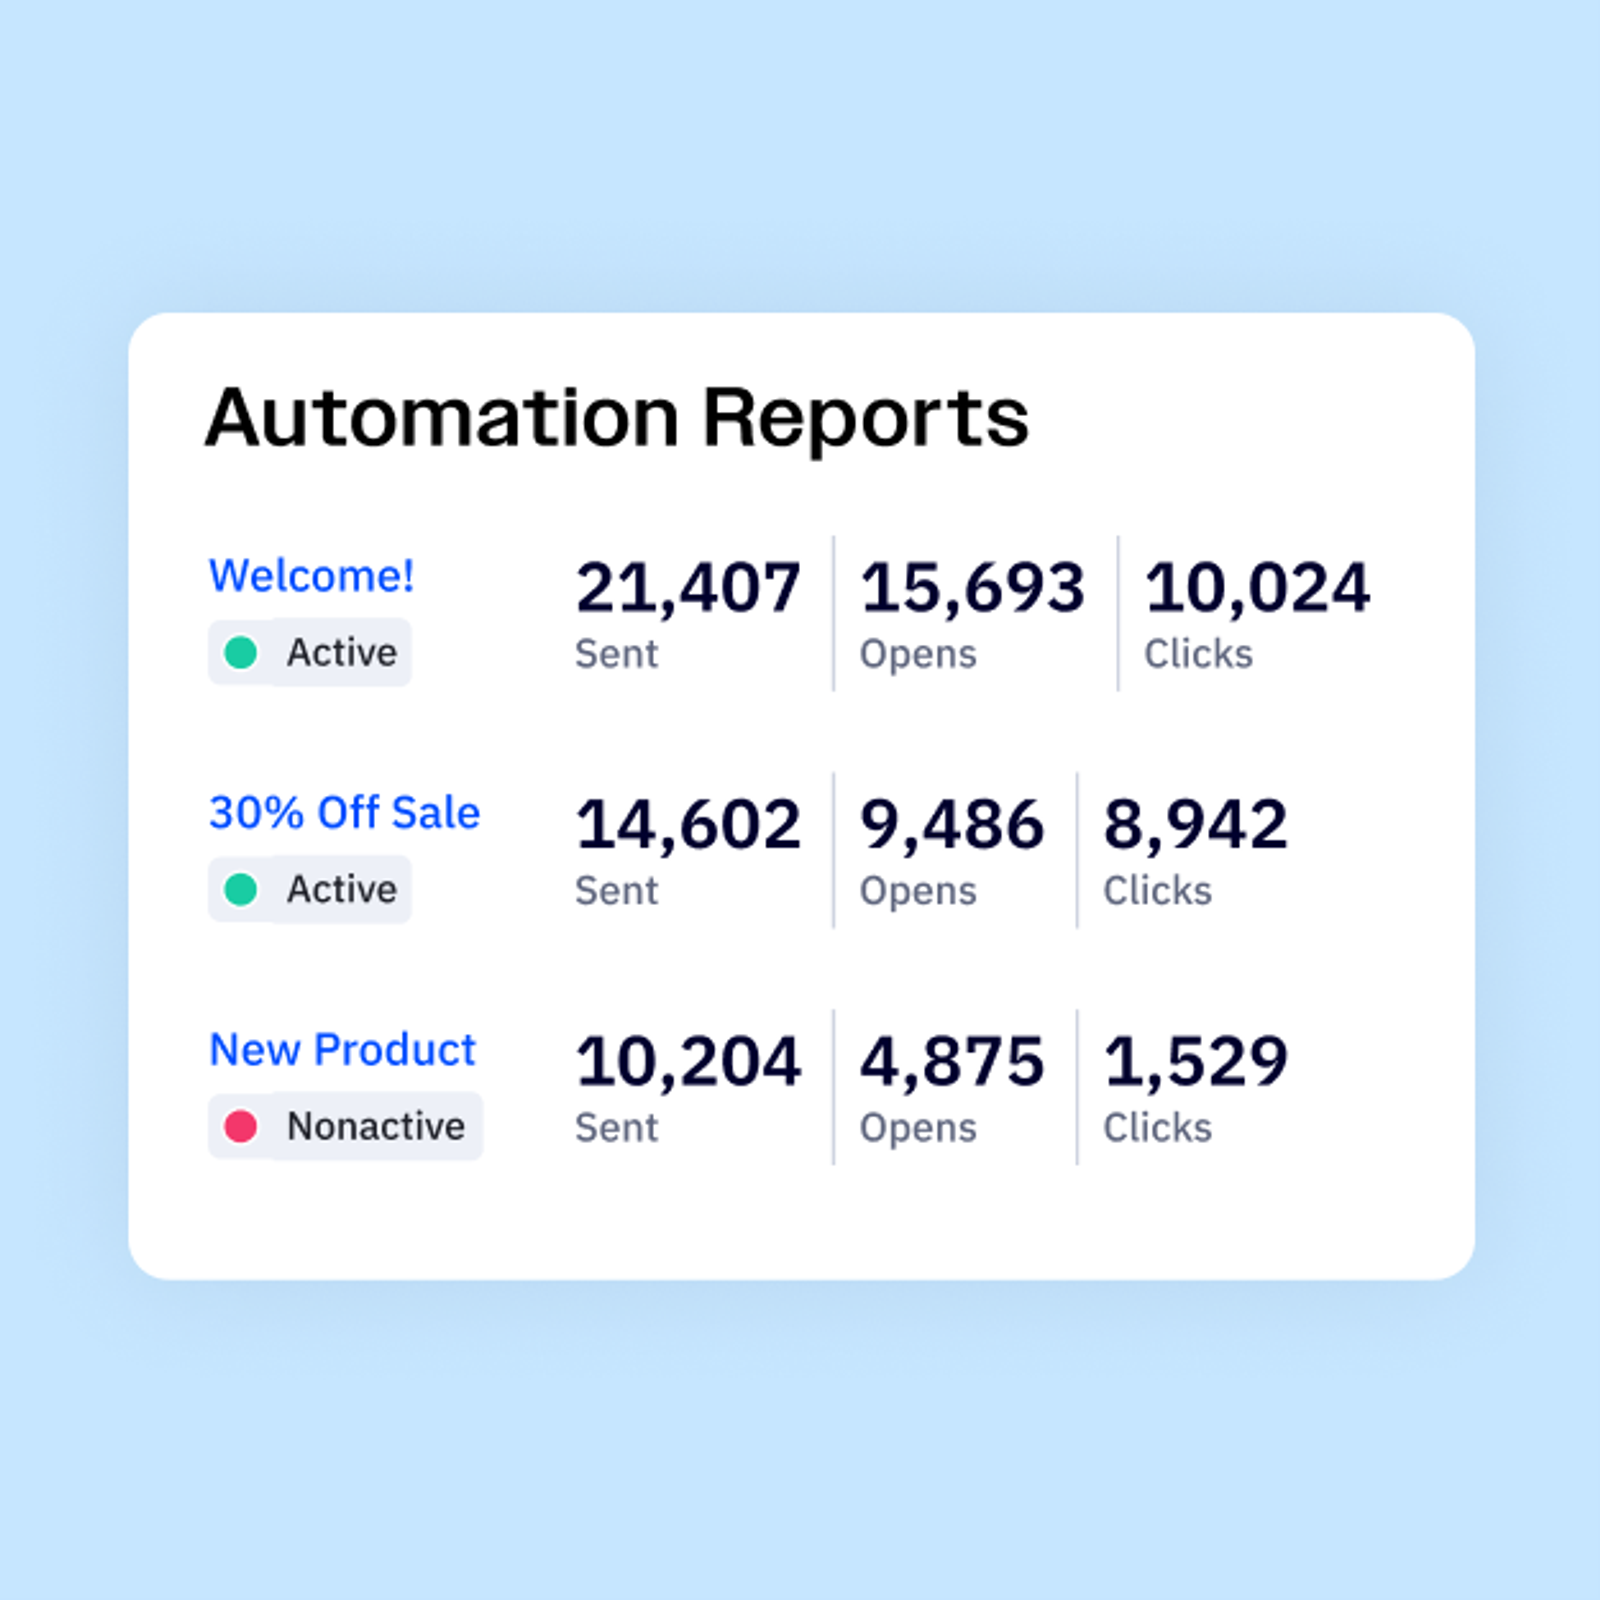
Sales engagement
Track the impact of your 1:1 outreach and see which personalizations have the biggest impact.
Contacts
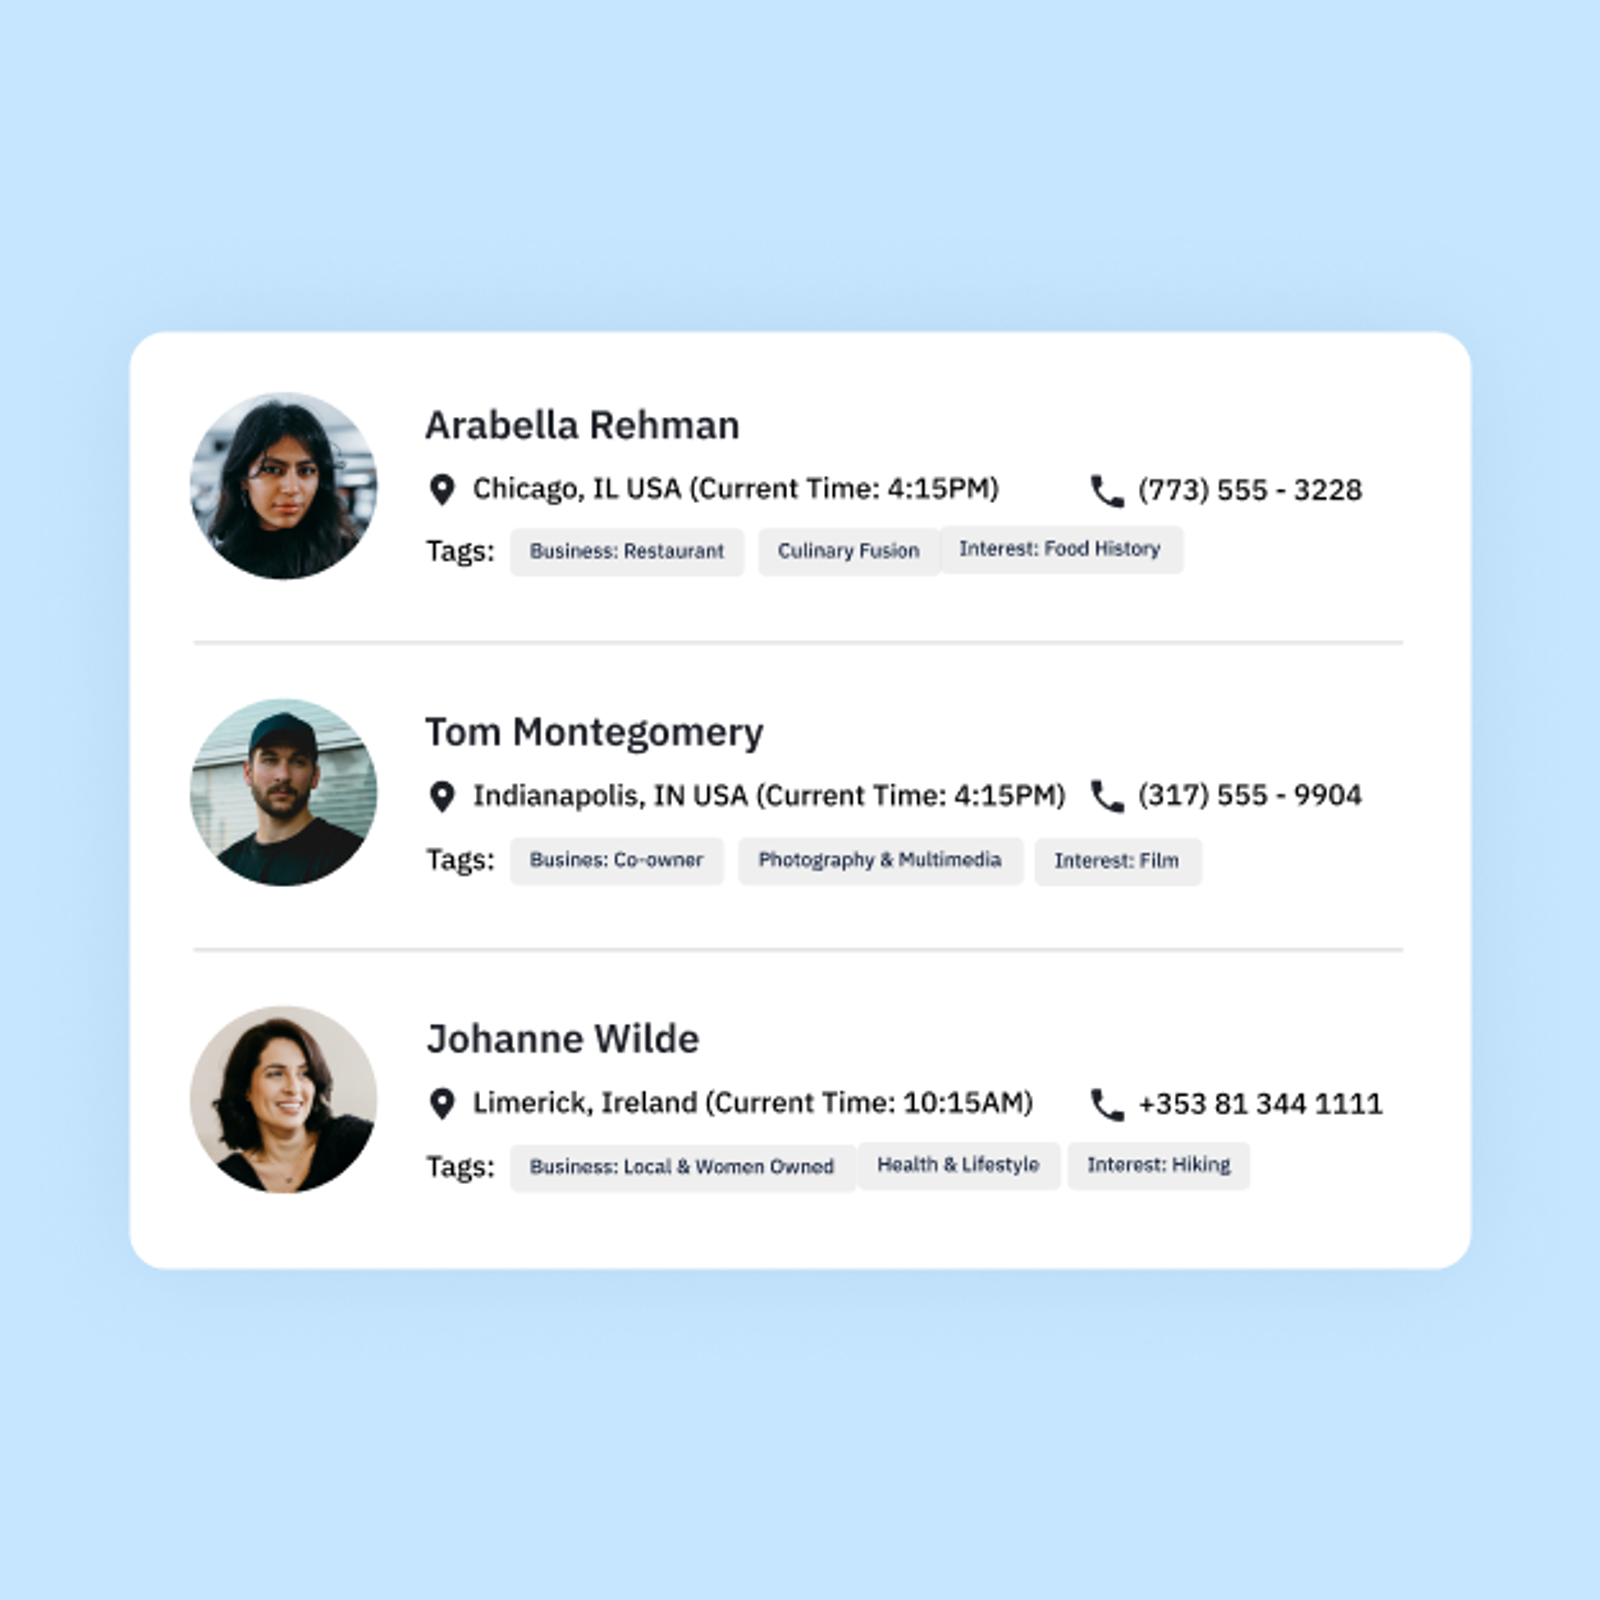
Get a holistic overview of your contact and tag trends, and get comprehensive field breakdowns across your segments.
Campaign performance
Explore open/read trends, predictive content sending times, and detailed info about your email client.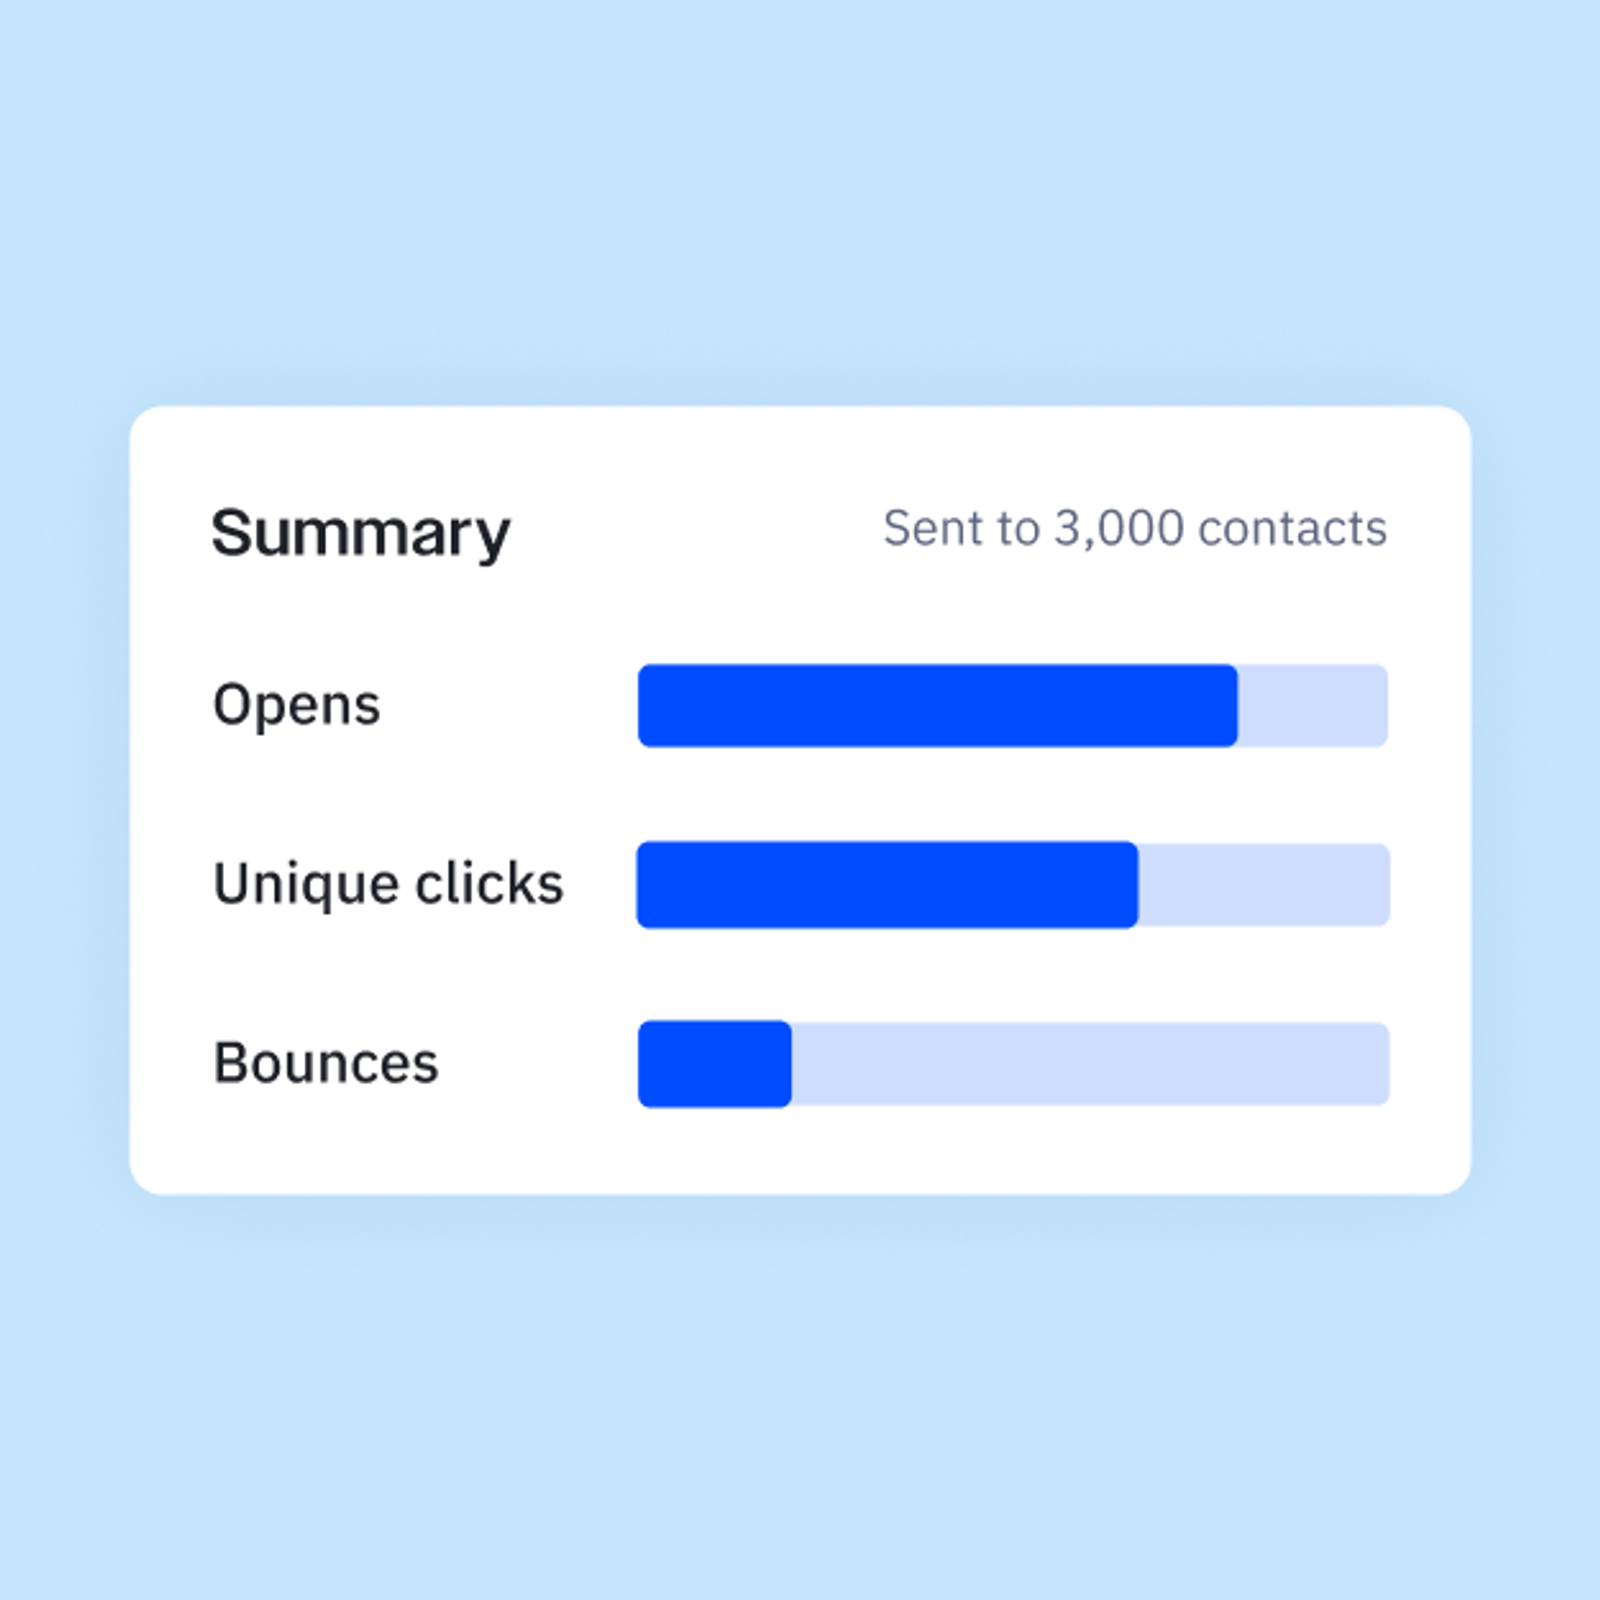
Find out more about your business’s growth
See which factors are driving your growth the most–and which ones are limiting it.
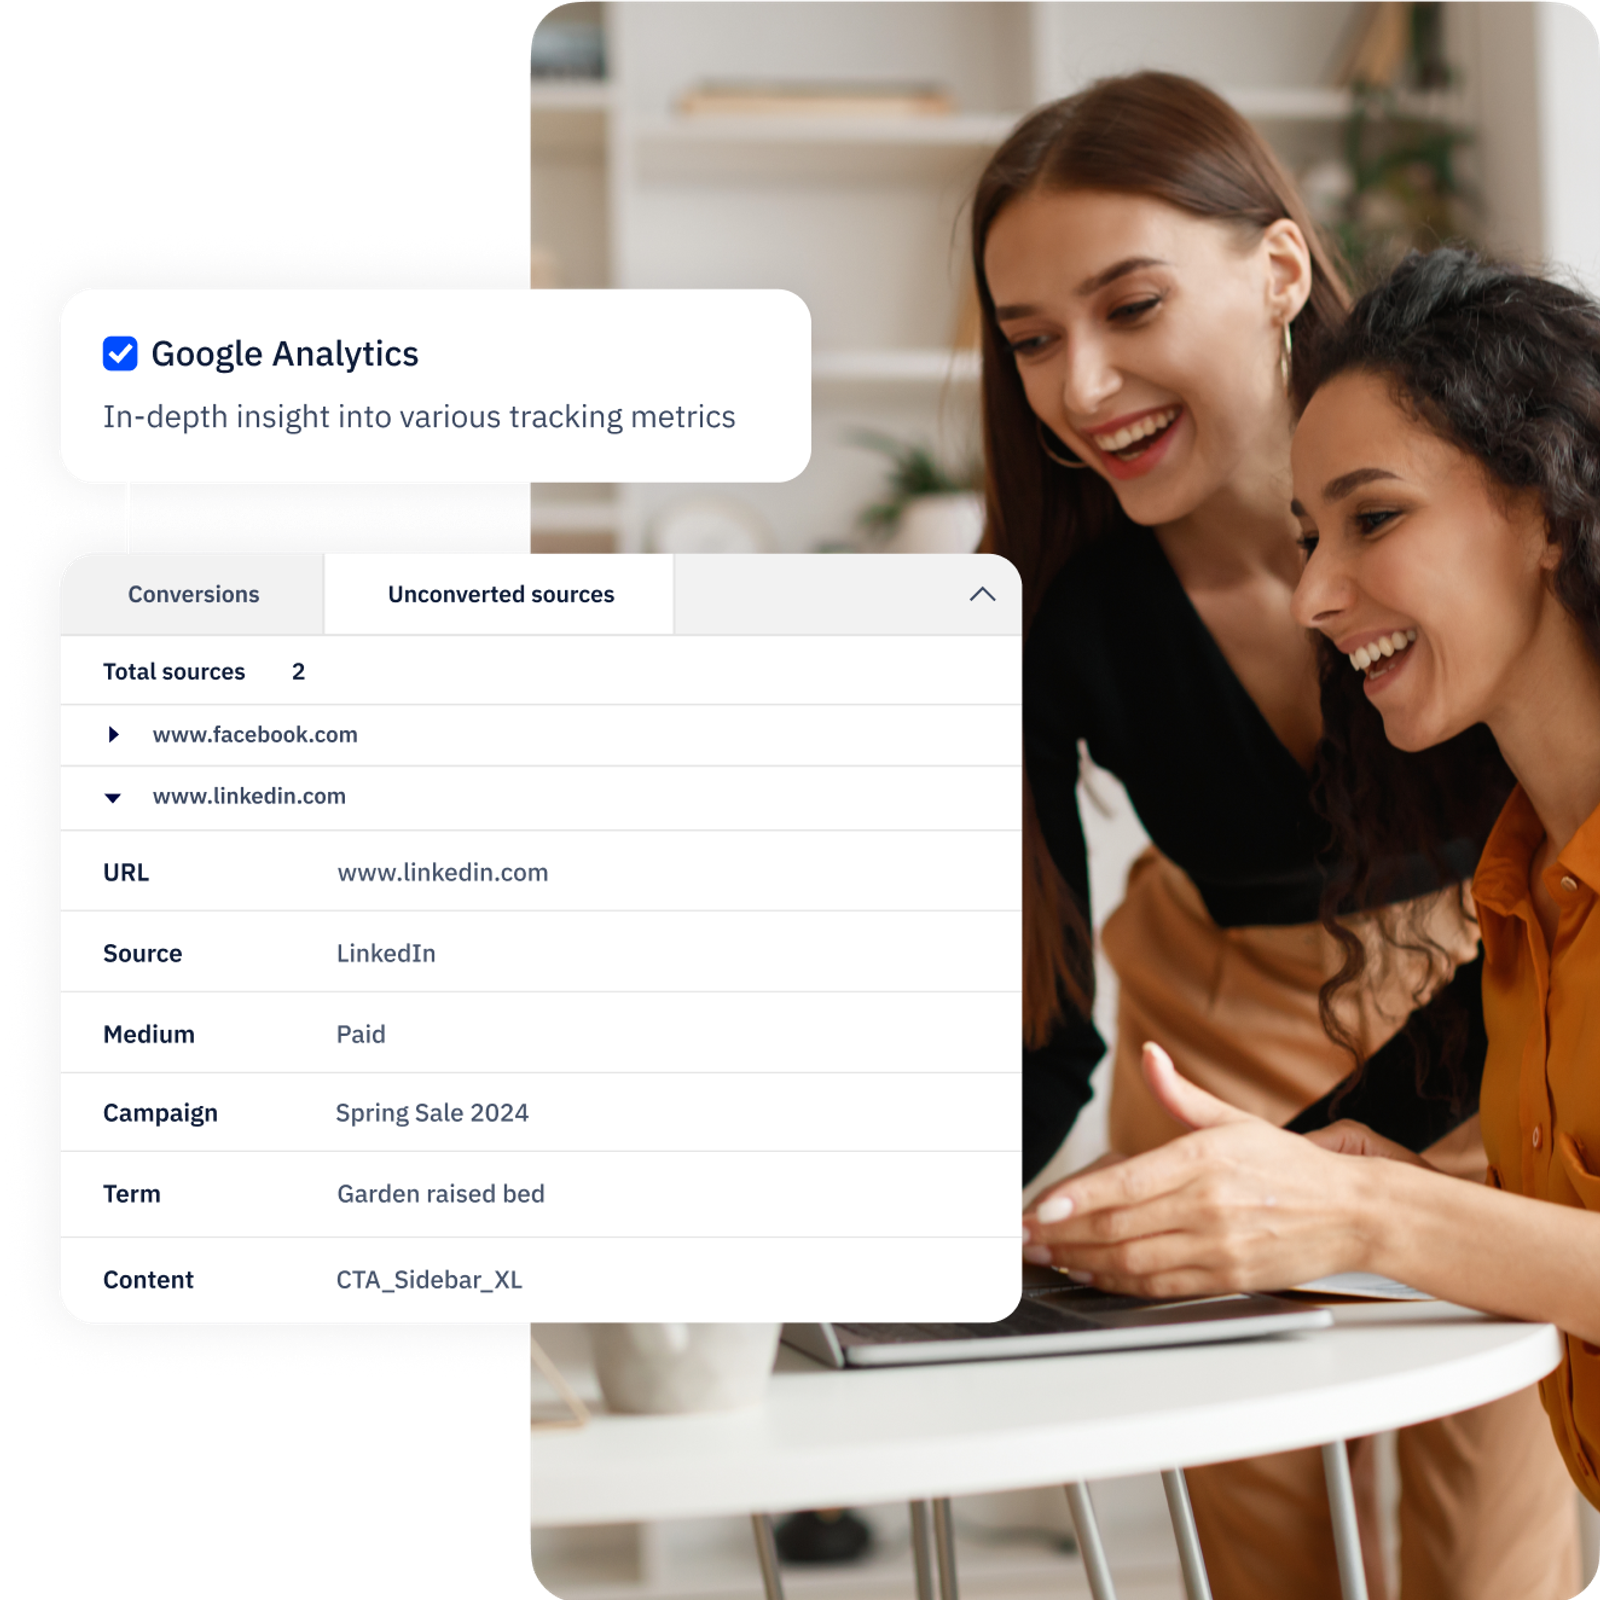
Measure form activity and get insights from site and event tracking.

Build custom reports in a few clicks
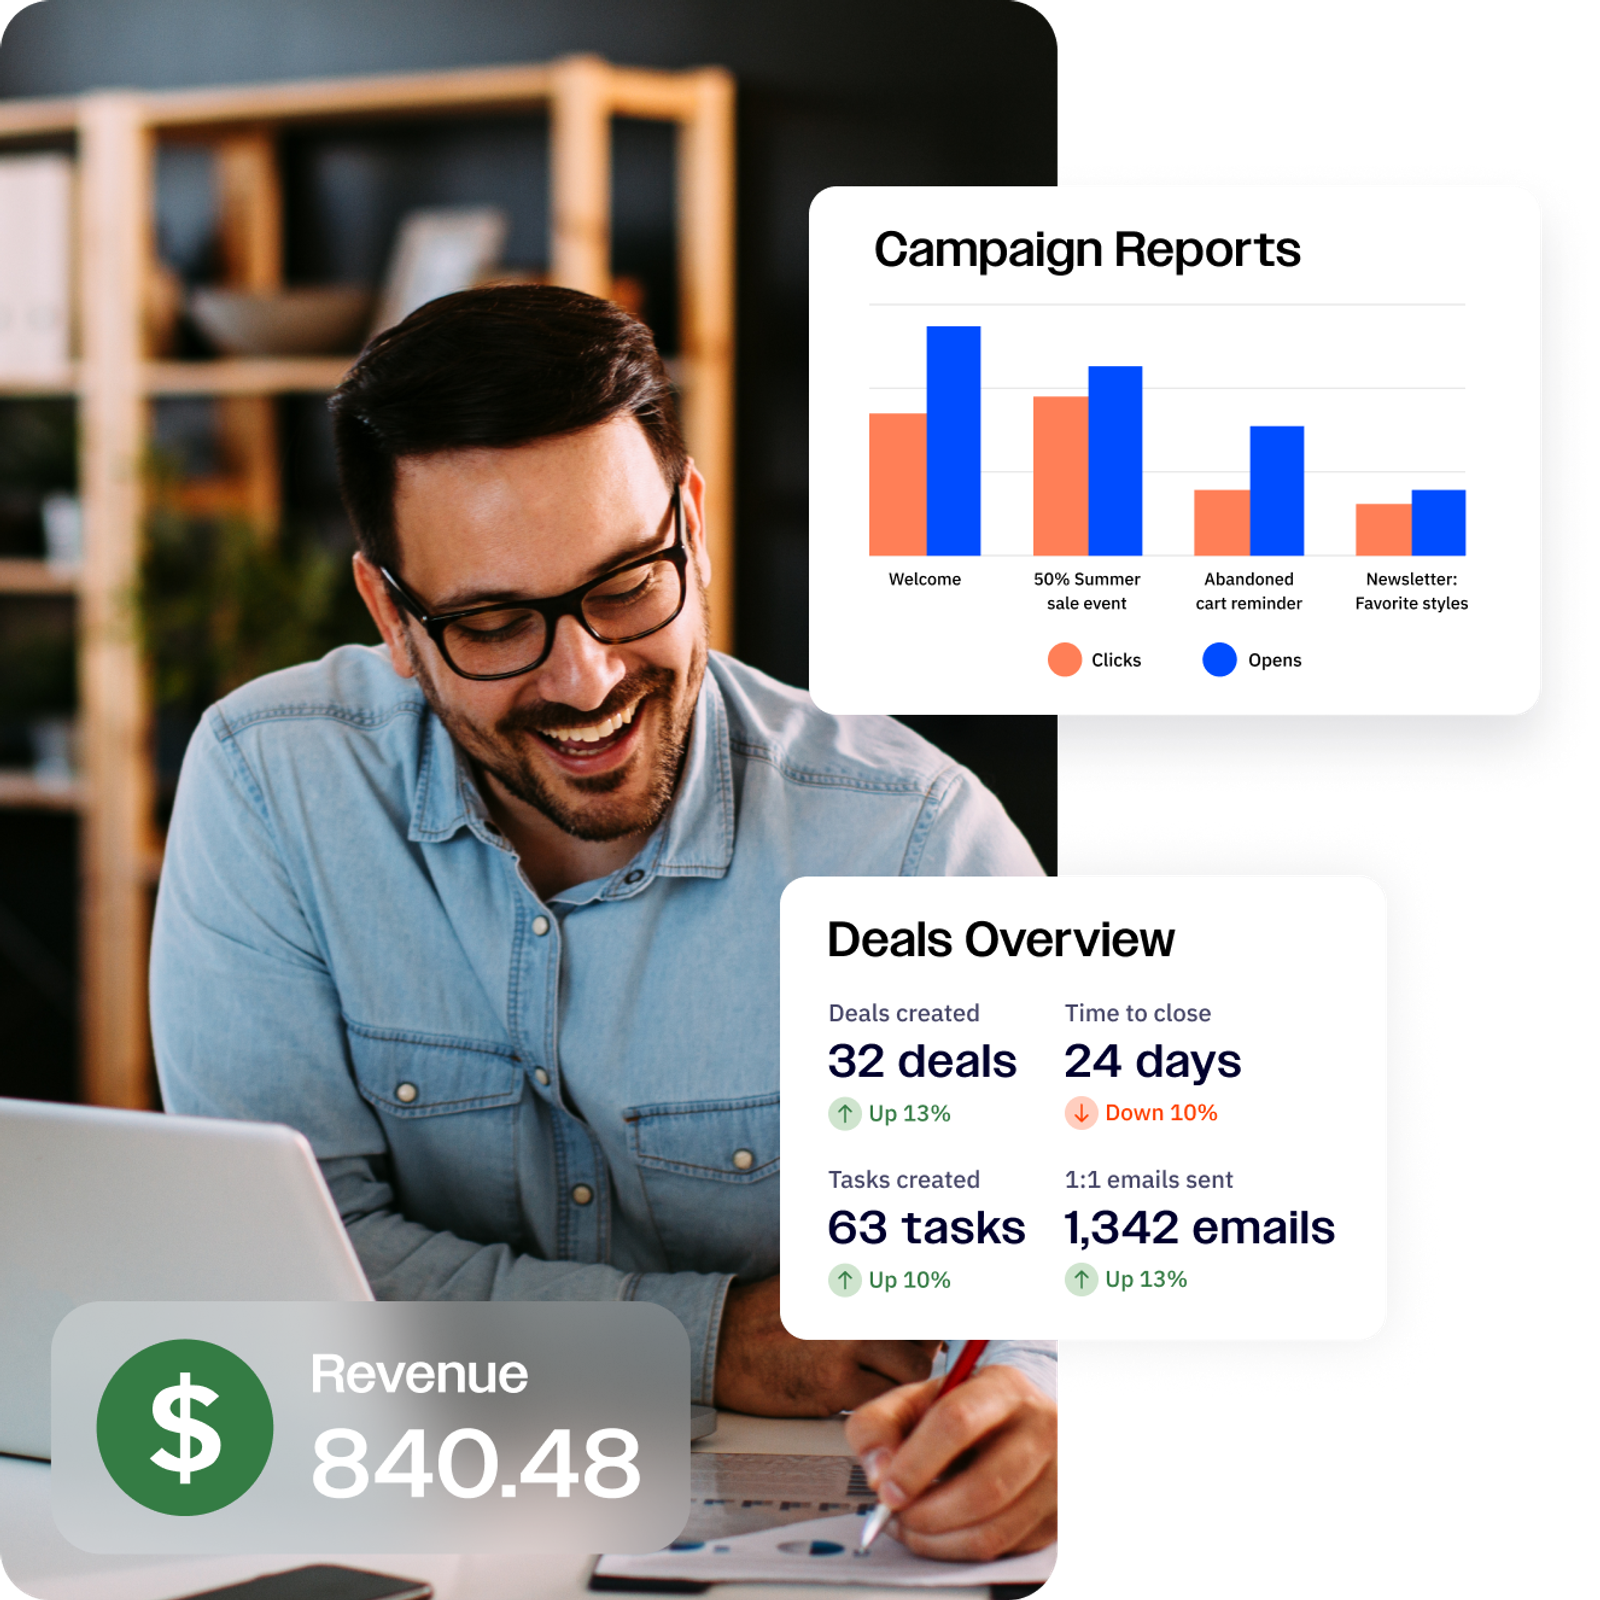
- A look is a single visualized report. Every report you create and save in ActiveCampaign will be its own unique look.

Capture the metrics that matter to you
Start tracking everything across your campaigns to build more relevant–and effective–marketing and sales initiatives.
- Engagement
- Deals won
- Site activity
- App events
- Sales performance
- Pipeline health
- Email opens
- Click-through rates
- Conversions
- Form completions
- 1:1 email replies
- Website visits
Deliverability
Site & Event Tracking
Effortlessly track user behaviors and actions across your website and gather actionable insights about your contacts and customers.
Split Testing
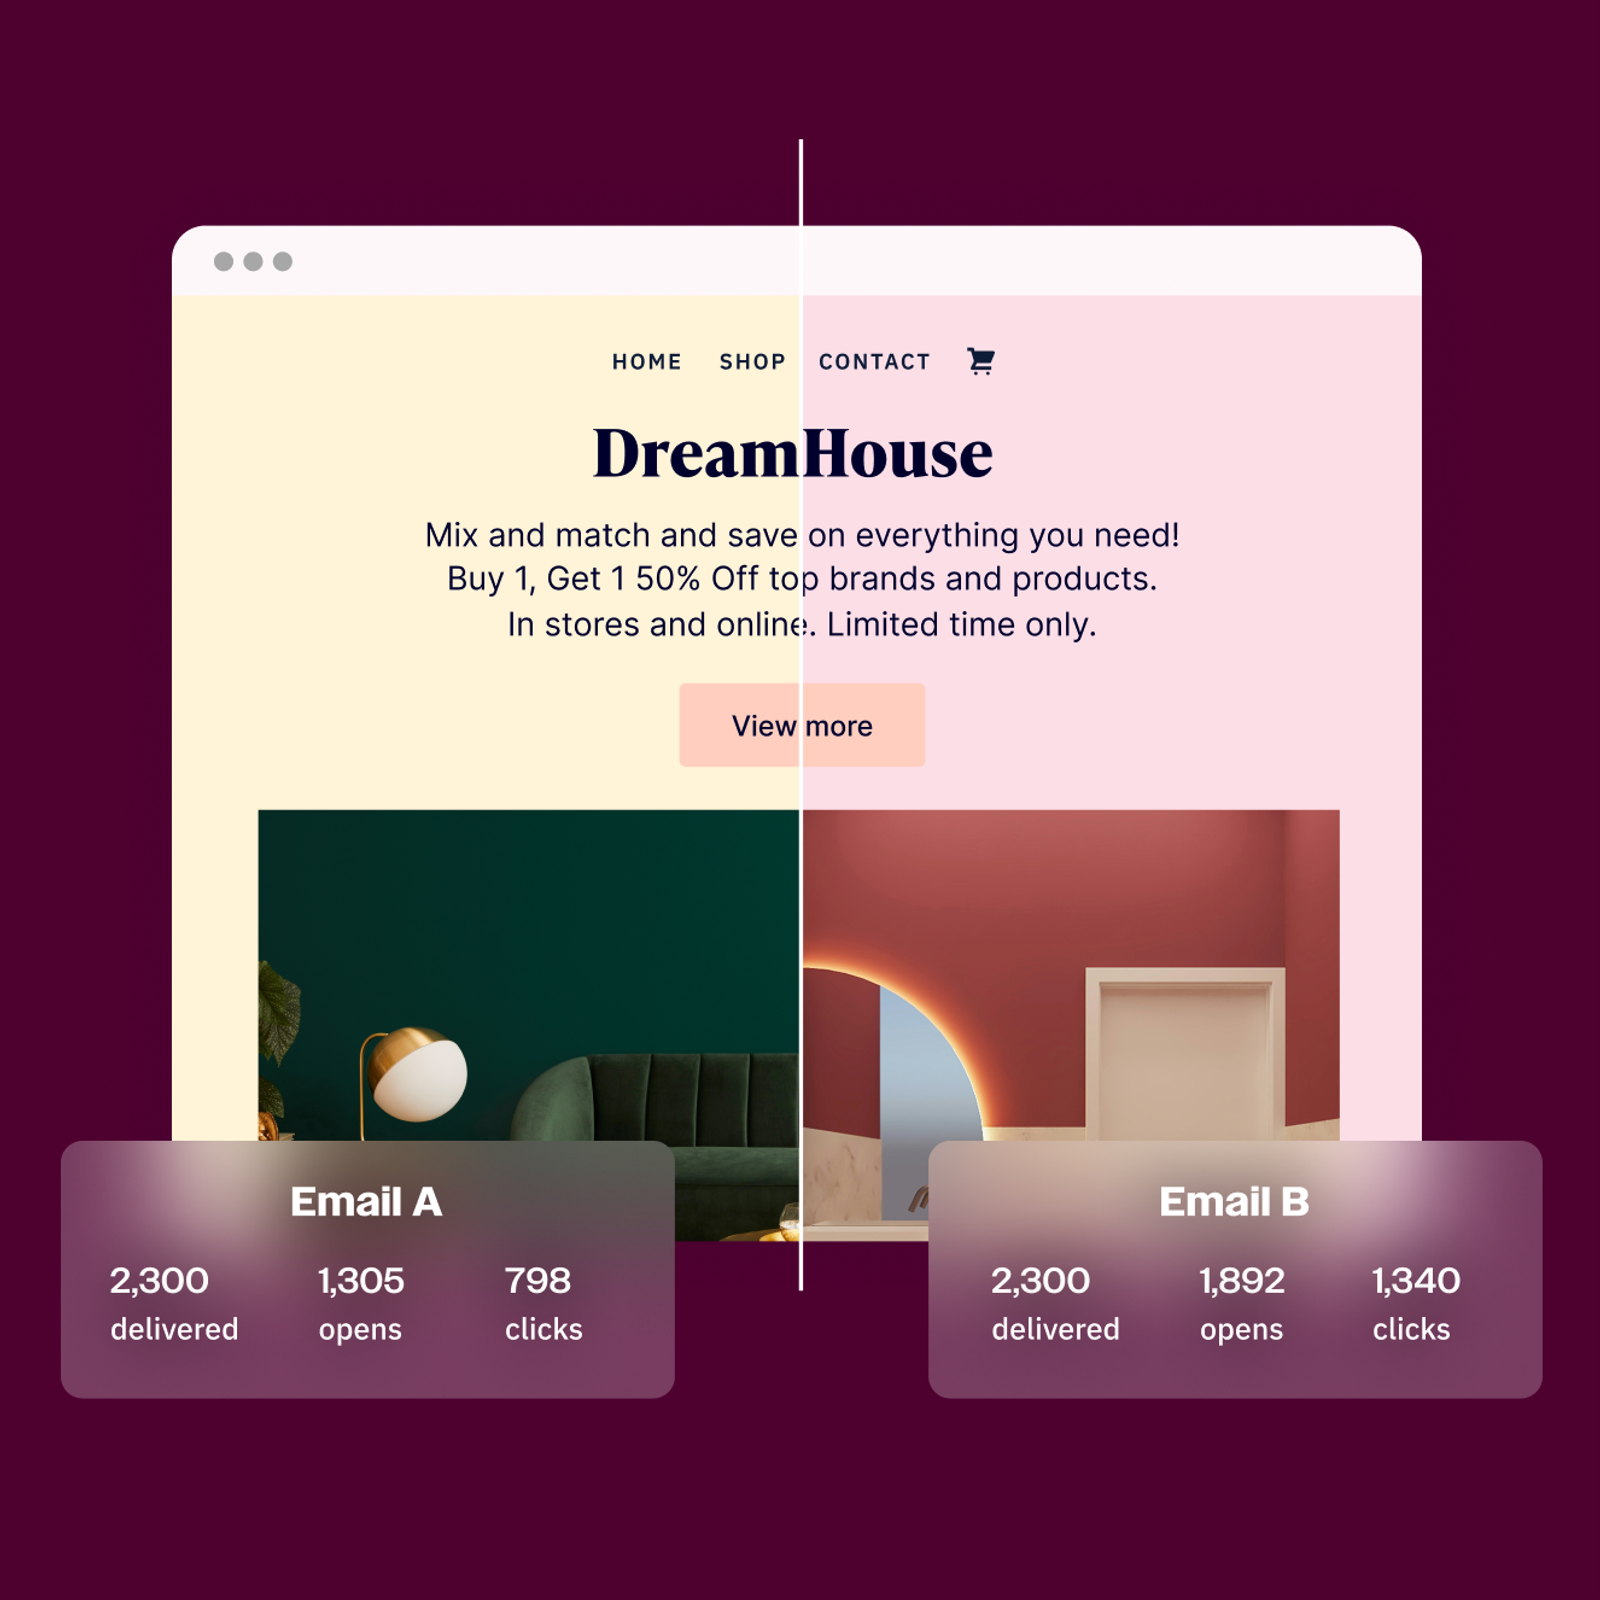
Don’t just A/B test your campaigns: A/B/C/D/E test them. Compare the performance of up to five options and always pick the winning variation.


